 If you keep tabs on the news, you’ve heard that the economy is slowing, with some analysts suggesting that the U.S. could face a recession by the end of the year. Inflation-adjusted consumer spending slowed to 1.5 percent in the first half of 2022 (per CNBC)—compared to nearly 12 percent a year earlier. The housing market seems to finally be slowing after two years of skyrocketing home values and minimal available inventory.
Amid a lot of uncertainty due to high inflation, rising interest rates and more, many people are tightening their belts for obvious reasons. For SiteSeer retail, restaurant and service business clients, that means it’s more important than ever to understand customers and their needs.
Food/dining is an area that has seen a lot of volatility, causing many consumers to cut back and/or change their habits. For our grocery and restaurant clients, this seemed ripe for analysis by the SiteSeer professional services team.
The Landscape: Soaring Prices
Here’s the current situation. According to the Bureau of Labor Statistics in August 2022, grocery prices soared 13.5% over the previous 12 months. That includes eggs costing fruits and vegetables costing 9% more and dairy costing 16^ more.
The price of food in particular is interesting to analyze because food isn’t something people can just stop buying like clothes or furniture. What they can do, however, is change their buying habits. Consumers used to shopping at Whole Foods who feel the pinch might opt instead for King Soopers. Those who typically dine out four times a week might have decided this year they’re going to pack their lunch and cook dinner at home more often.
An Analysis of Foot Traffic in Food Stores and Restaurants
We set out to answer the question that any business in grocery, restaurants or an adjacent industry probably has right now: how are current economic conditions affecting my business?
Without access to every chain’s financials to analyze consumer spending, we opted to use cell phone foot traffic data from our data partner, Precisely/PlaceIQ. Here’s what we did to analyze 125,000 food store and restaurant locations across 300 individual chains.
- We compared 3-month visitor foot traffic to the same period one year ago (summer 2021 vs. summer 2022).
- We divided each food store/restaurant location into price point (high, medium, low) and income group (high, medium, low) based on the population in the location’s trade area. While our method of determining high, medium and low household income was straightforward, determining high, medium and low price point for each restaurant chain was more subjective. Generally, this was our definition:
Restaurants
-
-
- High end: Upscale and casual dining establishments
- Medium: Fast-casual restaurants
- Low end: Fast food or quick service restaurants (QSR)
-
Food stores
-
-
- High end: Specialty, gourmet or natural/organic grocers
- Medium: Conventional grocers
- Low end: Price-impact and everyday low-price chains
- Locations that had a very high change in visitor traffic (+/- 50% quarter-over-quarter or year-over-year) were thrown out as data anomalies.
-
What We Learned About Consumer Behavior
Here are six things we discovered about shopper habits in uncertain times:
#1: People appear to be trading down to a lower price point in their grocery shopping.
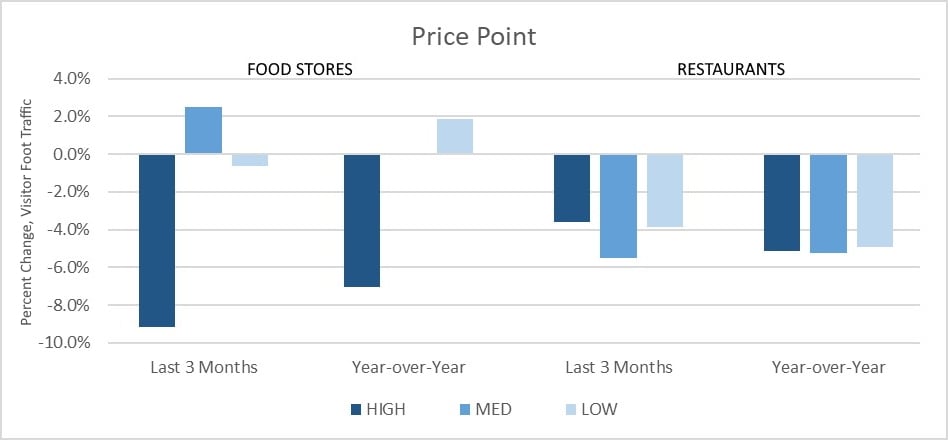
Low-price food stores are seeing foot traffic up nearly 2% year over year, while high-end grocers are down 7% year over year. And in the past three months, high-end grocers are down 9%. Interestingly, mid-price food stores are seeing higher foot traffic—up 2.5% in the past three months.
#2: People are going to restaurants less across the board.
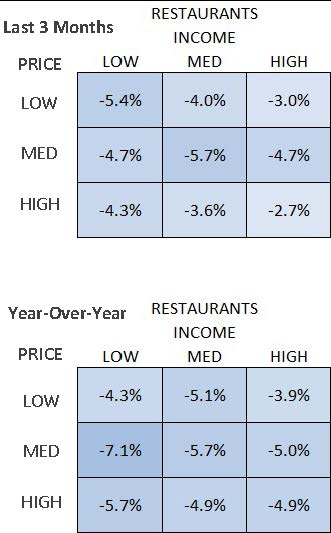
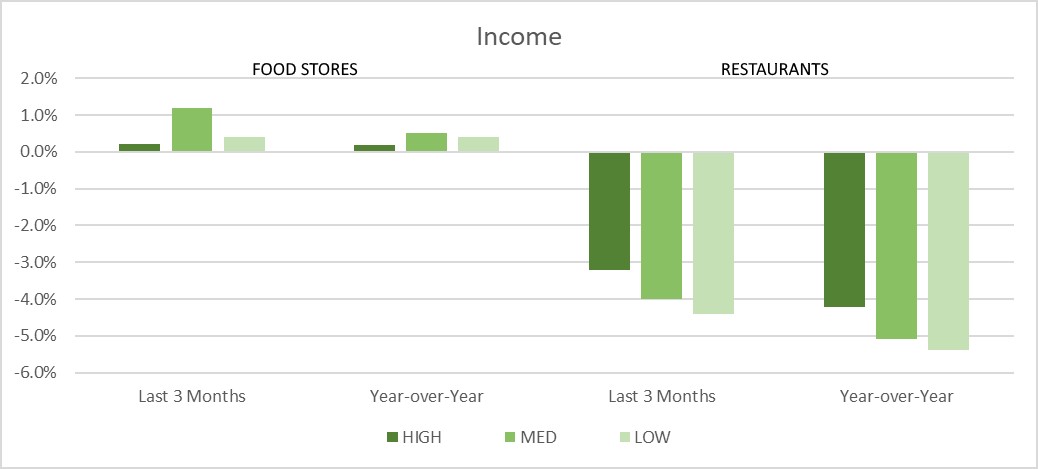
It seems that people are eating at home, with restaurant foot traffic down for low, medium and high-end restaurants at all income levels. Year over year, the biggest foot traffic decrease was in low-income consumers visiting medium-priced restaurants (a drop of 7.1%).

#3: People in all income brackets have reduced their visits to high-income grocery stores.
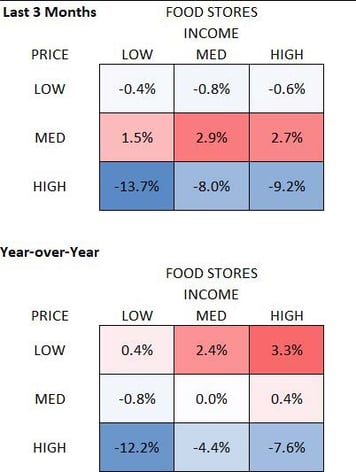
By far the biggest hit among food stores was taken by high-end grocers. They saw their foot traffic drop by as high as 13.7% among low-income consumers in the last three months and drop 12.2% in the last year (from the same consumer group). Even among high-income consumers, they saw a 7.6% drop in foot traffic year over year.

#4: Year over year, low-price food stores are seeing higher foot traffic.
Even high-income consumers are frequenting low-price grocer/food stores. Foot traffic for food stores year over year rose 0.4% for low-income consumers, rose 2.4% for medium earners, and rose 3.3% for high-income earners. (See #3 chart above.)
#5: Medium-priced food stores are seeing recent increases in foot traffic.
Across all income levels, medium-priced food stores saw an increase in foot traffic in the last three months. This is compared to minimal change in foot traffic year over year (See #3 chart above, summarized below.)
Last 3 months | Medium price food stores:
-
-
- Low-income consumer foot traffic +1.5% (-0.8% change year over year)
- Medium-income consumer foot traffic +2.9% (0% change year over year)
- High-income consumer foot traffic +2.7% (+0.4% change year over year)
-
#6: Food store visits are only up slightly vs. restaurant visits are down 4-5%.
This could simply mean that yes, people across all income levels are visiting restaurants less, but it doesn’t necessarily mean they’re going to (visiting) grocery stores more often. Perhaps they are spending more at the grocery store each visit (e.g., buying more food per trip) and making their groceries last longer.

Many Consumers Are Changing Their Habits
It’s clear that many consumers are changing their food/restaurant visiting habits. This CNBC article from August 2022 shares mixed observations from well-known restaurant chains:
- Chipotle and McDonald’s report that low-income consumers are spending less at their restaurants, while higher-income customers are spending more.
- Chuy’s Tex-Mex reports a broad consumer slowdown that can’t be split by income levels.
- Restaurant Brands International (parent of Burger King) said customers are redeeming coupons and loyalty program rewards more.
And this Morning Consult survey shares that 80% of consumers surveyed said they are eating out less often as a result of inflation. Also, 72% said they were buying less meat and 68% said they were buying less alcohol.
Understanding Your Customers is Key to Your Business’s Success
While there’s so much you cannot control these days, you can make an effort to understand your customers better. The more you know about your customers habits, pain points, preferences and changes in income level, the more you can adjust on your side.
SiteSeer can help! If you want to engage in a customer analytics program as you decide on your site selection goals, contact us. Our suite of tools will help you make better decisions.


