 If you’ve been following along, you know that during the months of April and May, SiteSeer was reporting weekly unemployment claims as a percentage in major metropolitan and micropolitan areas across the country. (Read our updates from 4/29, and for the weeks ended 4/27, 5/2, 5/9, 5/16, and our 6/26 update).
We stopped reporting that data because it left too many questions unanswered in a time when we are trying to offer up possible answers and not create more confusion. Read more about that decision here.
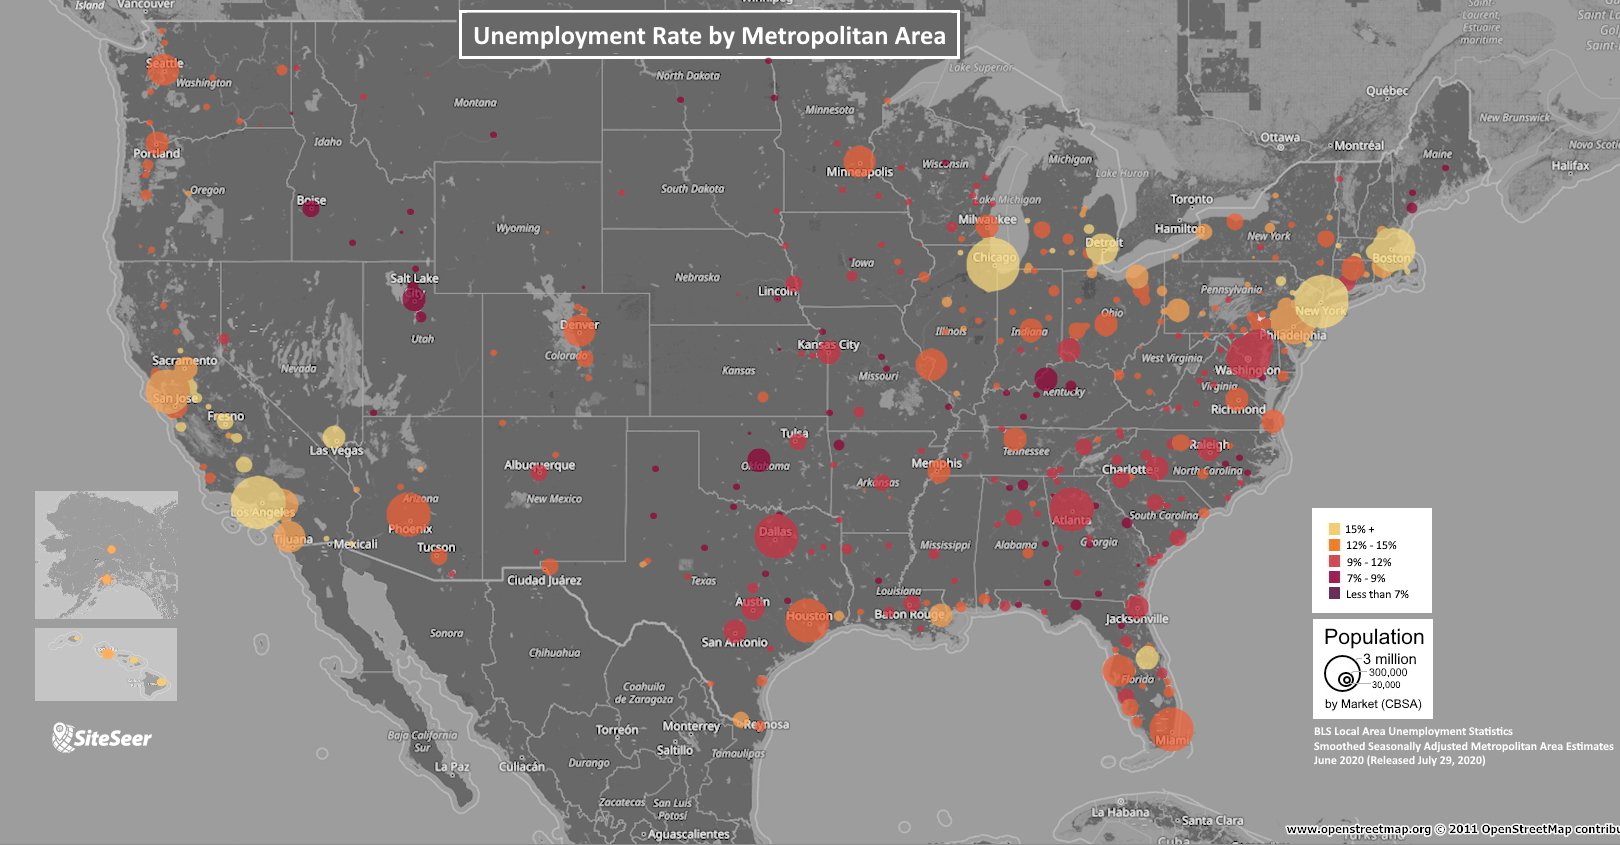
Although we are not reporting unemployment claims anymore, we thought it would be useful to take a look at unemployment rates.
As we all know, when COVID-19 hit earlier this year and businesses shut down everywhere in March, it had a significant impact on every single person in the entire world. Here in the U.S., suddenly people were out of jobs or furloughed, relying on unemployment assistance from the government to survive. Since then, a lot is in flux, but many states have allowed businesses to reopen at least partially.
Let’s compare the top 20 metropolitan areas in terms of unemployment rates between May 2020 and June 2020:
June 2020 Unemployment Rates
#20: Orlando-Kissimmee-Sanford, Florida | 22.9% [#9 at 22.9% in May]
#19: Salinas, California | 16.5% [Not in the top 20 in May at 20%]
#18: Flint, Michigan | 16.6% [#6 in May at 25.3%]
#17 (tied): Springfield, Massachusetts-Connecticut; Rockford, Illinois; Boston-Cambridge-Nashua, Massachusetts-New Hampshire | 16.7% [Not in the top 20 in May at 15.5%]
#16 (tied): New York-Newark-Jersey City, New York, New Jersey, Pennsylvania; Kokomo, Indiana | 16.7% [Not in the top 20 in May at 15.7%]
#15: Bakersfield, California | 17.4% [Not in the top 20 in May at 18.2%]
#14: Vineland-Bridgeton, New Jersey | 17.5% [Not in the top 20 in May at 16.1%]
#13: Los Angeles-Long Beach-Anaheim, California | 17.6% [Not in the top 20 in May at 19.2%]
#12: Detroit-Warren-Dearborn, Michigan | 17.7% [#8 in May at 23.2%]
#11 (tied): Visalia-Porterville, California; Muskegon, Michigan | 17.8% [Visalia-Porterville was #18 in May at 19.7% and Muskegon was #5 in May at 25.5%]
#10: Las Vegas-Henderson-Paradise, Nevada; Pittsfield, Massachusetts | 17.9% [#4 in May at 29.3%]
#9: East Stroudsburg, Pennsylvania | 18.0% [Not in the top 20 in May at 18.0%]
#8: Yuma, Arizona | 18.1% [Not in the top 20 in May at 17.3%]
#7: Leominster-Gardner, Massachusetts | 18.6% [Not in the top 20 in May at 17.4%]
#6: Barnstable Town, Massachusetts | 19.7% [#17 in May at 19.9%]
#5: New Bedford, Massachusetts | 21.3% [#12 in May at 21.7%]
#4: Kahului-Wailuku-Lahaina, Hawaii | 22.3% [#1 in May at 33.5%]
#3: Ocean City, New Jersey | 26.7% [#7 in May at 24.6%]
#2: El Centro, California | 28.7% [#3 in May at 30.0%]
#1: Atlantic City, Hammonton, New Jersey | 35.0% [#2 in May at 32.7%]
May 2020 Unemployment Rates
#20: Lakeland-Winter Haven, Florida | 19.4%
#19: Niles-Benton Harbor, Michigan | 19.6%
#18: Visalia-Porterville, California| 19.7%
#17: Barnstable Town, Massachusetts | 19.9%
#16: Urban Honolulu, Hawaii | 20.0%
#15 (tied): Bay City, Michigan; Rockford, Illinois; Jackson, Michigan | 20.6%
#14: Saginaw, Michigan | 21.3%
#13: Monroe, Michigan | 21.6%
#12: New Bedford, Massachusetts | 21.7%
#11: Kokomo, Indiana | 22.1%
#10: Battle Creek, Michigan | 22.6%
#9: Orlando-Kissimmee-Sanford, Florida | 22.9%
#8: Detroit-Warren-Dearborn, Michigan | 23.2%
#7: Ocean City, New Jersey | 24.6%
#6: Flint, Michigan | 25.3%
#5: Muskegon, Michigan | 25.5%
#4: Las Vegas-Henderson-Paradise, Nevada | 29.3%
#3: El Centro, California | 30.0%
#2: Atlantic City-Hammonton, New Jersey | 32.7%
#1: Kahului-Wailuku-Lahaina, Hawaii (Maui) | 33.5%
A few important things to note about this data:
- This unemployment data is not based on claims data, but rather unemployment "rate,” or percent unemployed.
- Unemployment rate includes anyone who does not currently have a job and who has been looking for a job (in the period reported, which in this case is May and June.
- Figures include people who lost their jobs but did not file an unemployment claim (this could be due to working an informal job, due to retiring early, due to simply choosing not to file an unemployment claim, or due to some other reason).
Still High, Some Movement in the Right Direction
So, without a doubt, unemployment rates are concerning still, with the top 20 metro areas in June ranging from rates of 22.9% to 35.5%. But when comparing May to June, things are moving in the right direction in some metro areas. Six of the top 20 metro areas in May were no longer in the top 20 in June (Battle Creek, MI; Monroe, MI; Saginaw, MI; Bay City, MI; Jackson, MI; Urban Honolulu, HI). That said, in two of the metro areas in the top 20 both in May and June, unemployment rates worsened (In Atlantic City-Hammonton, the unemployment rate went from 32.7% in May to 35.0% in June; in Ocean City, the unemployment rate went from 24.6% in May to 26.7% in June).
As we continue to say, this is the year of the unexpected. It’s important to look to the data when we can to understand today’s constantly changing landscape. This helps businesses make more sound decisions when thinking about stores to open or close or how to approach markets differently.
If the SiteSeer team can help you as you navigate a COVID-19 marketplace, contact us for a demo of our powerful site selection software and more about how our professional services team might be able to help you build forecasting models, plan markets and more.

