
Those in market research and site selection know what an impact technology has had on the tools and methods we use to make decisions (or help our clients make decisions). In recent years we have experienced the move from desktop software with steep learning curves to user-friendly subscription-based software-as-a-service that runs from an internet browser. We have gone from finding, gathering and installing data updates ourselves, to having countless up-to-date data sources available when we log in. But perhaps one area has seen the greatest evolution in the past few years the rise of artificial intelligence or “AI” for sales forecasting.
Traditional Sales Forecasting
Since before computers were found on every business desktop, retail real estate professionals have used predictive models to estimate future sales for their prospective store. The early manual or “back of the napkin” calculations later gave way to specialized statistical and GIS (mapping) software that made statistical and spatial calculations in minutes instead of hours or even days, but the principals were largely the same.
Models typically fell into one of several categories:
- Simple scoring models that measured the quantity of potential customers and the quality of a site
- Spatial or “gravity” models that simulated customer behavior based on the Law of Retail Gravitation
- Analog or nearest neighbor models that compared a site to existing stores on key performance indicators
- Statistical models, such as regression models
The Rise of AI and Machine Learning
So, what exactly is an AI model?
An AI model (or more specifically a machine learning model) uses one or more specialized techniques to “train” on historical data and then use the resulting learnings to forecast future events.
In the retail real estate world, the “training set” of data is typically data currently operating stores and their various attributes – trade area population and demographics, site characteristics, market factors, etc. The AI model will run through hundreds or even thousands of iterations of data combinations to see which produce the best forecasts.
Compared to a traditional linear regression model where a modeler determines the best data combinations and that resulting static formula is used for months or even years without changing, the AI model is built on the fly each time a site is run. This means that the AI model improves as new stores open, as store sales change and market conditions evolve.
AI Models Are Smart and "Learn" Over Time
For example, a regression model that was built at the beginning of 2022 and run at the end of 2022 would likely under-forecast due to large increases in inflation throughout the year. By contrast, the AI model would “learn” about inflation by observing changes in the training data, and create better forecasts. Even if market conditions were to stay the same over time, AI models typically produce more accurate forecasts than traditional statistical models and are less prone to producing wild swings in forecasts. For these reasons and with a few exceptions, AI models have become the preferred approach for retail sales forecasting.
So, What’s the Catch About AI Modeling?
Despite the proliferation of AI and its many success stories, many companies are hesitant to use and trust AI models and instead continue to use alternative and sometimes inferior methods for sales forecasting. Some of these companies were burned by adopting AI early when many modelers made unsubstantiated claims or simply used the new technology incorrectly.
Although AI technology makes it much easier to create an adequate model, a highly accurate model still requires a skilled modeler that knows how to “tune” the model. Just as an untuned instrument will play music, an untuned model will produce an adequate forecast. Knowing how to feed the software the right data and parameters will almost always result in a better forecast.
The second factor that has historically hurt adoption of AI is transparency. Unlike other forecasting techniques, AI has the reputation of being a black box – data goes in, forecasts come out and no one knows how what happens in between. In the hurry to utilize this exciting new technology, many modelers rushed AI models out and expected users to blindly trust them. Since it can often take years before one knows if forecasts for new sites are accurate, it is very important that forecasts are fully explainable. No one wants to stick their neck out with a forecast that can’t be explained to decision makers and stakeholders.
Transparency in Modeling
Since our inception, SiteSeer has recognized that many of our professional services clients value explainability as highly as accuracy. Thus, we welcome our clients to be heavily involved in the model development process. We teach our clients how their models work, the shortcomings of these models, and how to explain them to their organizations. Our software also provides views into how the models produce their forecasts. We also know that the industry has a ways to go to make transparency the norm and win back the trust lost from the early days of AI. We are pleased to see that explainability is becoming more of a priority in the industry and the term eXplainable AI or “XAI” has started to trend in modeling circles.
As of this writing, SiteSeer’s Location Decision Engine – or modeling engine – supports XAI. All SiteSeer machine learning models produced since spring 2022 provide users with the ability to view the following components of their forecasts:
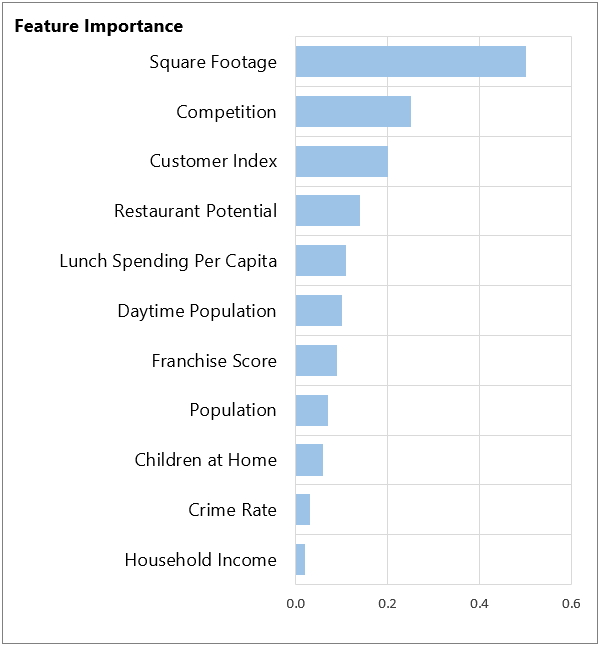
Feature importance
The data that a model uses to arrive at a forecast are called “features.” From the training set – typically one’s current store base – the model learns which of these features are most important to arriving at an accurate forecast and which are less important.
SiteSeer’s Feature Importance graph lists each feature the model uses, along with a relative measure of how important that feature is compared to the rest of the features the model utilized. The features near the top of the list are most important, those at the bottom are less important.
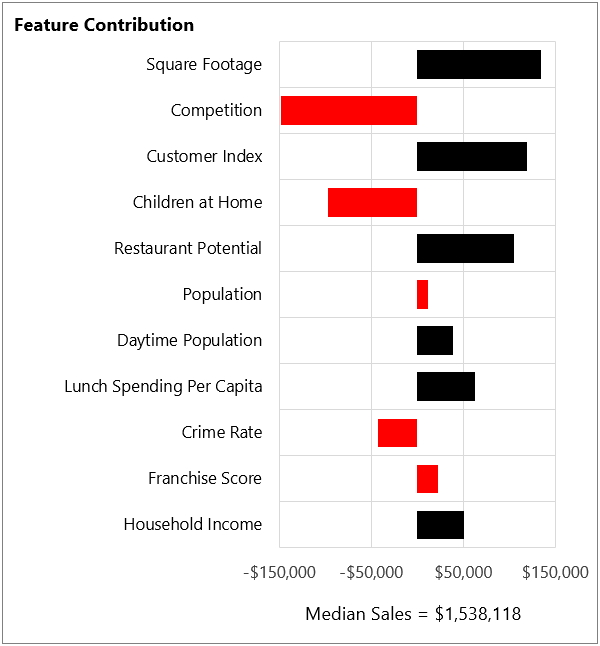
Feature contribution
Where Feature Importance describes the training set, Feature Contribution describes one’s site. Specifically, which features were most valuable when arriving at the site’s sales forecast. Feature Contribution not only tells you how important a feature was to your site’s forecast, it quantifies it in real dollars or sales units. Not only will you know how important a particular feature is to your forecast, Feature Contribution will tell you how many dollars that feature added or subtracted from your forecast. Confusing? Let’s illustrate this with an example.
Example: Restaurant Concept
Take a look at the screenshots above for a hypothetical restaurant concept.
The Feature Importance table shows the features that were most important when training the model to learn about the chain’s existing restaurants.
In the example, the most important features were:
- Size of the restaurant (square footage)
- Level of competition
- Match between the trade area demographics and lifestyles with a typical customer
Less important features were:
- Presence of children at home
- Crime rate
- Income
The Feature Contribution chart tells us for the site that we are forecasting how the model got to its forecast.
In this example, a typical restaurant in my chain does $1,538,118 in sales. Each of the features shown adds to or takes away from that forecast. So, reading from top to bottom, square footage adds $135,000 in additional sales to my forecast. Presumably, this is a large piece of real estate I’m considering for my new restaurant and more square footage means more seats which means more sales. With this bigger footprint, this site can be expected to do $1,538,118 + $135,000 = $1,673,118.
Our second feature – Competition – takes away $148,000, so now our site is back down to $1,673,118 - $148,000 = $1,525,000. Again, presumably competition is higher than normal here and any gains I got from my large square footage were negated by competition.
By the time you work my way through all variables, adding and taking away sales from my forecast, you end up at about $1,797,000 in sales forecast (about 17% higher than my average restaurant). So, despite some negatives like high competition, too few children in the trade area, and a somewhat elevated crime rate, this is more than offset by my high square footage, great customer match, and high restaurant potential.
Technology Evolves, and So Do Our Forecast Modeling Methods
Five years ago, forecasting using AI was a hot topic and many in our industry were quick to hop aboard the train. We believe today what we believe now: site selection and sales forecasting is a combination of art and science. An accurate sales forecast depends on good data, but because some data is much harder to collect than other data, it requires the modeler and the user to make assumptions as well.
AI and machine learning have come a long way, and the fact that we can understand and explain it better only increases one’s confidence that they can make educated predictions about the future. It’s difficult to blindly accept that a method is superior to other methods when you cannot look under the hood, so to speak. XAI provides that look.
At SiteSeer, we are committed to using best-in-class modeling methodologies but caution our users that models and data are simply tools. Tools can make our lives easier, and produce better outcomes, but tools also have limitations. It is our goal to continue to be a champion of movements like explainable forecasting that empower users to use the most important tool they have – their experience and judgement.
Contact us to learn more about how we can help you make better decisions using explainable AI and other methodologies!