 You may have heard the news last week that SiteSeer is soon updating its data to reflect the 2020 U.S. Census. As such, we wanted to release our newest iteration of our semi-annual population study.
2023 Population Estimates Updated from Census 2020
This study looks at STI: PopStats data for April 2023 compared to one year ago, April 2022. Unlike the previous iterations of this blog, this is the first to be estimated from the recently released Census 2020 base population and boundaries. So, keep in mind that there may be some changes, and some micropolitan areas are now considered metropolitan areas (and vice versa).
Past Population Studies
Here’s a rundown of our past population studies, which use U.S. Census 2010 data:
The 15 Fastest-Growing Metropolitan and Micropolitan Areas (10/2021 to 10/2022)
The 15 Fastest-Growing Metropolitan and Micropolitan Areas (4/2021 to 4/2022)
The 15 Fastest-Growing Metropolitan and Micropolitan Areas (10/2020 to 10/2021)
The 15 Fastest-Growing Metropolitan and Micropolitan Areas (4/2020 to 4/2021)
The 15 Fastest-Growing Metropolitan and Micropolitan Areas (10/2019 to 10/2020)
The 15 Fastest-Growing Metropolitan and Micropolitan Areas (6/2018 to 6/2020)
The Definition of Metropolitan vs. Micropolitan Areas
And here are important definitions from the United States Office of Management and Budget (OMB):
- Micropolitan areas are those with a core urban area of at least 10,000 but fewer than 50,000 people.
- Metropolitan areas have at least one city with a population of 50,000 or higher.
As of July 2023, there are 387 metropolitan statistical areas and 538 micropolitan statistical areas in the United States.
Top 15 Fast-Growing Metropolitan Areas
And now a look at the 15 fastest-growing metropolitan areas in the U.S. between April 2022 to April 2023:
#15: Ocala, Florida | 2.80%
#14: Homosassa Springs, Florida | 2.89%
#13: Hinesville, Georgia | 2.96%
#12: Austin-Round Rock-Georgetown, Texas | 2.97%
#11: Spartanburg, South Carolina | 3.02%
#10: Daphne-Fairhope-Foley, Alabama | 3.07%
#9: North Post-Sarasota-Bradenton, Florida | 3.08%
#8: Greeley, Colorado | 3.14%
#7: Port St. Lucie, Florida | 3.22%
#6: St. George, Utah | 3.32%
#5: Cape Coral-Fort Myers, Florida | 3.52%
#4: Panama City, Florida | 3.58%
#3: Punta Gorda, Florida | 4.06%
#2 (tie): Myrtle Beach-Conway-North Myrtle Beach, South Carolina/North Carolina, and Lakeland-Winter Haven, Florida | 4.09%
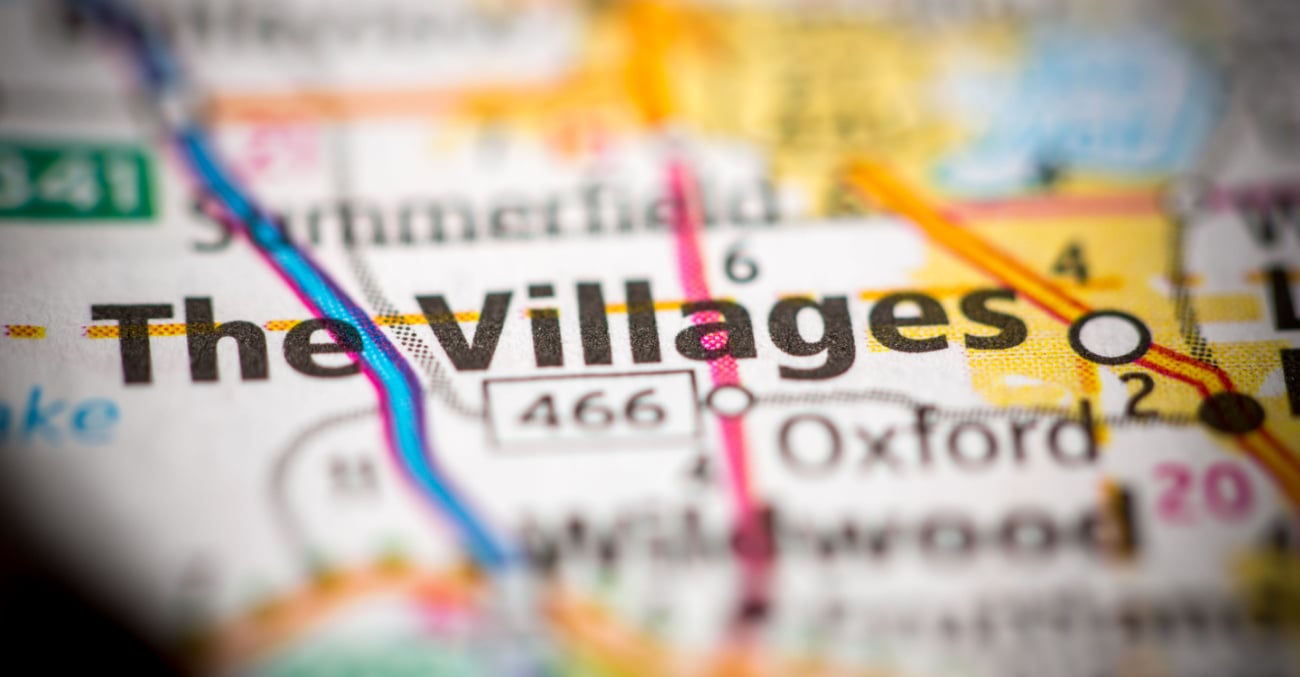
#1: The Villages, Florida | 6.67%
A few observations about metropolitan area growth:
- Growth has slowed some. In our previous study, 46 metropolitan and micropolitan areas had at least 2.5% annual growth. This year, only 34 markets meet that threshold.
- Florida continues to be a hot commodity, comprising nine of the top 15 metros for growth.
- George, Utah, finally relinquished the #1 growing spot, dropping to #6.
- Regionally, the south is popular! Of the top 20 top metropolitan areas (22 actually, as there was a tie at the #18 spot and the #2 spot) 19 are found in the sun belt (the southern third of the U.S.). Only Greeley, Colorado bucks the trend.
- The three largest U.S. cities (New York, Los Angeles and Chicago) have lost population in previous studies, but all have maintained steady during this period. Los Angeles grew slightly (4,411 people, 0.03%), while Chicago lost 836 people (-0.01%) and New York lost 4,171 people (-0.02%).
- Of the 50 largest metropolitan areas, 41 saw growth. Those with the largest gains include Austin, Jacksonville, Raleigh, Orlando, Dallas-Fort Worth, Nashville and San Antonio.
- No large metro area saw greater than a 0.5% drop in population, but the biggest losers include Pittsburgh, Buffalo, St. Louis, San Francisco, and Memphis.
Top 15 Fast-Growing Micropolitan Areas
Now let’s take a look at the 15 fastest-growing micropolitan areas in the U.S. between April 2022 to April 2023:
#15: Menomonie, Wisconsin | 2.11%
#14: Kalispell, Montana | 2.15%
#13: Durant, Oklahoma | 2.21%
#12: Sandpoint, Idaho | 2.28%
#11: Brookings, South Dakota | 2.29%
#10: Huntsville, Texas | 2.32%
#9: St. Marys, Georgia | 2.38%
#8: Prineville, Oregon | 2.42%
#7: Lewisburg, Tennessee | 2.76%
#6: Clewiston, Florida | 2.90%
#5: Granbury, Texas | 3.06%
#4: Pullman, Washington | 3.07%
#3: Statesboro, Georgia | 3.09%
#2: Cedar City, Utah | 3.10%
#1: Jefferson, Georgia | 5.11%
A few observations about micropolitan area growth:
- On the micropolitan areas list, the south also seems to have the most growth (seven of the top 15 growers are in southern states).
- Micropolitan areas in states like Utah, Idaho, Colorado and Washington still top the list of fast-growers, but the growth has cooled there more than elsewhere. This could be due to increasing housing costs coupled with high interest rates.
- The #2 fastest-growing micropolitan area from our previous population study, (Mountain Home, Idaho, which was actually #1 using 2020 Census data), dropped far down the list this time, and only saw a 0.7% population increase.
- There are several newcomers to the list, including some that weren’t even in the top 100 previously. Those include Statesboro, Georgia; Pullman, Washington; Brookings, South Dakota; and Menomonie, Wisconsin. There’s no real obvious pattern here (e.g., southern states), but it is interesting nonetheless.
On August 28, 2023, SiteSeer subscribers will find that the platform’s 2023 population estimates are updated from Census 2020. This population study is a sneak peek of the new population data from STI: PopStats (the August release that compares population for Q2 2023 to Q2 2022—April 2023 to April 2022).
Many of our clients and colleagues have been eagerly awaiting the Demographic and Housing Characteristics File and Demographic Profile update from the U.S. Census Bureau. As a result, we’ve decided to do another iteration of this population study in six months, when STI: Popstats shares its semi-annual population data update. Look for that around January 2024!


